Visual Acuity 101: The Snellen Chart Demystified
- BY Dr. Steven Liem
- IN Eye Care
When it comes to assessing our vision, the Snellen Chart is a common tool used by eye care professionals worldwide. But what exactly does it measure, and why is it important? Whether you’re due for an eye exam or simply curious about how your vision is measured, this iconic chart holds the key to understanding your visual acuity.
Origins and Evolution
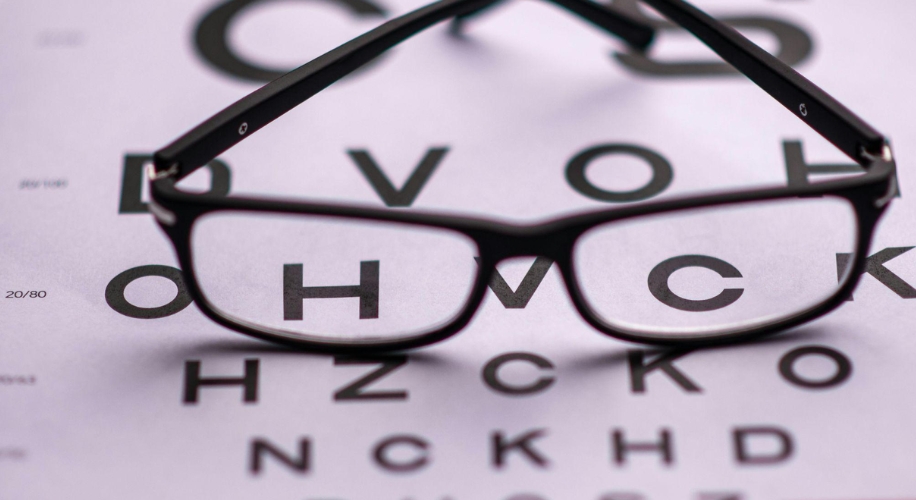
Named after the Dutch ophthalmologist Herman Snellen, the Snellen Chart made its debut in 1862. Its design was simple yet revolutionary: a series of letters, each decreasing in size as you move down the chart. This logarithmic progression allows for precise measurement of visual acuity, from the 20/20 standard down to the minutest details of vision.
Over the years, variations of the Snellen Chart have emerged, each tailored to specific needs and cultural contexts. However, the fundamental principle remains unchanged: to assess how well you can see at a distance.
The Testing Process
When you undergo a visual acuity test, your eye care professional will guide you through the process of reading the Snellen Chart. You’ll be positioned at a standardized distance from the chart, usually 20 feet or 6 meters, and asked to cover one eye at a time while reading the lines of letters aloud.
As you progress down the chart, the letters become progressively smaller, testing the limits of your visual perception. Your optometrist will note the smallest line you can accurately read and use this information to determine your visual acuity.

Interpreting Visual Acuity
The results are recorded as a fraction, with the numerator representing the distance at which the chart is viewed (usually 20 feet), and the denominator representing the distance at which a person with normal vision could read the same line.
For instance, if your vision is 20/40, it means that you can see at 20 feet what a person with normal vision can see at 40 feet. Conversely, if your vision is 20/15, you have sharper vision than the average person, being able to see at 20 feet what most can only see at 15.
Beyond the Traditional Chart
While the Snellen Chart remains a staple in eye care, modern technology has introduced alternative methods for assessing visual acuity. Digital charts, computerized tests, and mobile applications offer flexibility and precision in measuring vision, particularly in diverse clinical settings.
Additionally, specialized charts have been developed for specific populations, such as children or individuals with low vision. These charts may feature symbols or shapes instead of letters, ensuring accessibility for all.

The Importance of Regular Eye Exams
Understanding your visual acuity is crucial for maintaining eye health and overall well-being. Regular eye exams include visual acuity testing, and allow for early detection of vision problems and prompt intervention when needed. Visual acuity can be affected by refractive errors such as nearsightedness, farsightedness, and astigmatism. Other conditions such as cataracts, macular degeneration, and diabetic retinopathy can also impact visual acuity.
Whether you have perfect 20/20 vision, need glasses to see, or prefer to wear contact lenses, it is important to get regular eye exams and monitor changes in your vision.