Demystifying Vision Charts: How Optometrists Test Visual Acuity
- BY Catherine Ong
- IN Eye Health
Eye test charts are instrumental in measuring visual acuity, which is a fancy way of saying they help your optometrist assess how well you can see. The most recognizable one may be the Snellen chart, that familiar grid of letters with “the Big E” and letters decreasing in size as you move down the chart. But there’s more to these charts than meets the eye, and understanding them can provide a clearer picture of your eye health.
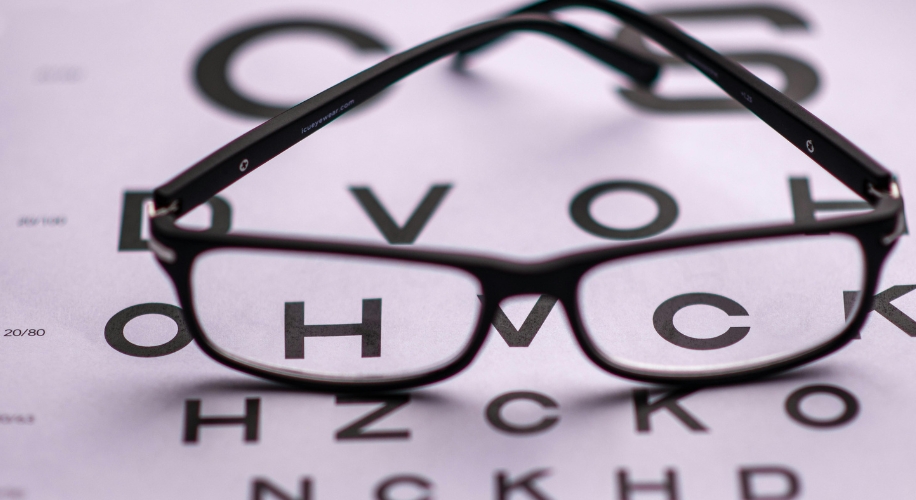
Photo by Skyler Ewing
The Snellen Chart: An Optometry Classic
The Snellen chart is the most common eye test chart used worldwide. Developed by the Dutch ophthalmologist Hermann Snellen in the 19th century, it remains a staple in optometric practices. The chart is usually read while standing 20 feet away, with letters representing the standard of normal vision at that distance. You’ve likely heard the term “20/20 vision”, but what does it mean? A person with 20/20 vision can clearly see at 20 feet what a person with normal vision can see at the same distance. If you have 20/40 vision, it means that you need to be as close as 20 feet to see what a person with normal vision can see at 40 feet. Thus, the higher the second number, the worse the vision.
Other Types of Eye Test Charts
While the Snellen chart is most common, there are other types of eye test charts used for specific situations or age groups. These include:
- HOTV Chart: Ideal for people who may not yet know all their letters, the HOTV chart is formatted similarly to the Snellen Chart with rows of letters decreasing in size. However, it enables matching for identification which makes this test ideal for young children or patients who may not know the whole Roman alphabet.
- The LogMAR chart: Often used in research, this chart standardizes the presentation of its letters by utilizing the concept of a logarithmic scale. It uses letters of similar legibility, spaces its letters and rows uniformly, and is recorded in units of LogMAR where “MAR” stands for the Minimum Angle of Resolution.

Photo from Pexels by Gustavo Fring
How Optometrists Use Eye Test Charts
Optometrists use eye test charts to assess your visual acuity and identify any vision correction needs. If you find yourself straining to read the lower lines of the chart, it might be time to get some glasses. You can choose classic glasses or trendy glasses. If you’re already wearing glasses, struggling with the eye chart could indicate a need for a prescription update.
Regular eye check-ups help diagnose and treat eye conditions early, ensuring you maintain the best possible vision. Visual acuity charts are just one tool in a comprehensive eye examination. Optometrists help perform comprehensive eye exams to ensure that both your vision needs and eye health are in optimal condition. Schedule your next eye exam today!